 農業
農業
 トラクター
トラクター
 ジョンディア
 トラクター作業機
 ガイダンス・自動操舵
 田植機
田植機
 コンバイン・乾燥調製
 ミニ耕うん機・管理機
 乗用管理機
乗用管理機
 ティラー・耕うん機
 草刈機
草刈機
 無人ヘリ・ドローン
 野菜機器
野菜機器
 大豆機器
大豆機器
 畜産・酪農機器
 運搬車
運搬車
 除雪機
除雪機
 水管理システム
 ミニショベル/油圧ショベル
 ホイルローダー
 発電機
発電機
 マリンプレジャー
 プレジャーボート
 漁船
漁船
 マリンエンジン
 海洋設備
海洋設備
 大形舶用エンジン
 高速主機関
高速主機関
 中速主機関
中速主機関
 舶用補機
舶用補機 SCRシステム
 二段過給システム
 電気推進システム
 舶用デュアルフューエルエンジン
 金属ばね防振システム
 エネルギー
エネルギー
 GHP
GHP
 常用コージェネレーション
 非常用発電システム
 ポンプ駆動システム
 カーボンニュートラル
 廃熱ソリューション
 建設機械
建設機械
 キャリア
キャリア
 汎用関連機器
 投光機
投光機
 アタッチメント
 純正部品
純正部品
 産業エンジン
 立形水冷ディーゼルエンジン
 立形水冷ガスエンジン
 空冷ディーゼルエンジン
 横形水冷ディーゼルエンジン
Research & Development Center
ヤンマーテクニカルレビュー
Design Method for Hydro-Mechanical Transmission for Vehicle: Prediction of Noise Based on 1D and 3D Simulation
Abstract
For agricultural tractor, these two performances have been very important; high efficiency and maneuverability because the operator has increasingly required the fewer fuel consumption and easier and more precise control of the tractor. Therefore, new hydraulic mechanical transmission (HMT) has been developed specially to fit their demands. HMT is well known for the high efficiency level thanks to their splitting power flow between mechanical and hydraulic path. Moreover, its step-less variable speed feature is suitable for the operator demand such as quick and smooth speed change. However, HMT is hydraulic powered system then hydraulic noise may more often occur than the pure mechanical transmission; such as power-shift transmission or dual clutch system. Purpose of this paper is to show how to design tractor transmission with HMT concerning with hydraulic noise.
1. Developed HMT
1.1. Structure Overview
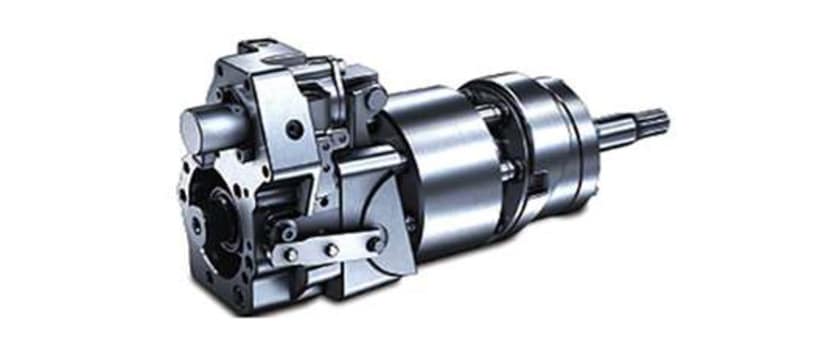
Conventional tractors transmission technology mainly consists of "mechanical" or "hydraulic" types. Fig.1 shows appearance of newly developed HMT (Hydraulic Mechanical Transmission), which has the concept that it brings both high transmission efficiency of mechanical type and high maneuverability of hydraulic type. The main features of this HMT are as following;
- Only one plunger block into which plungers of pump and motor are inserted.
- Spool mechanism which switch hydraulic oil path while the expansion and compression process.
- Continuous variable speed control with the electromagnetic proportional valves.
2. Procedure of Sound Pressure Level Prediction
2.1. Procedure
In order to predict the hydraulic noise level, calculation procedure has been developed as shown in Fig.2.
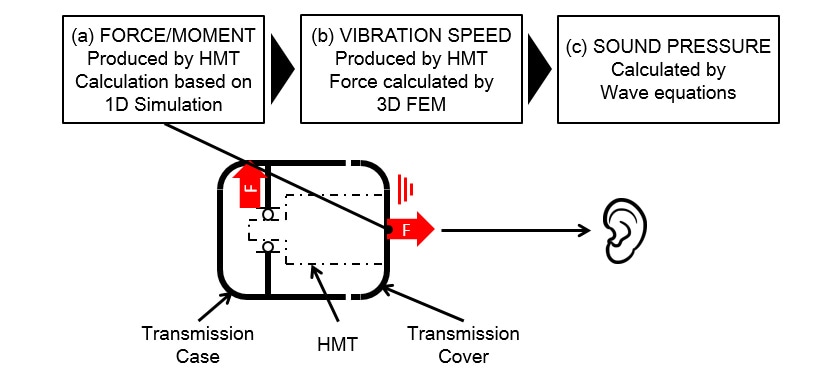
Each steps of the procedure are as following;
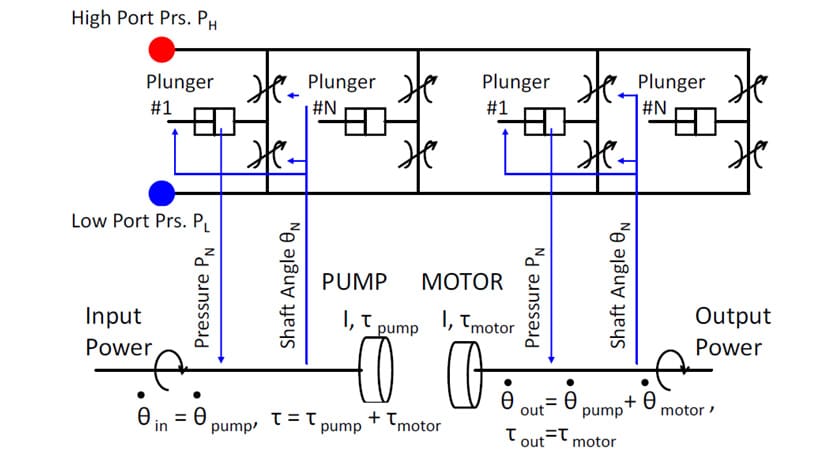
(a) Hydraulic pressure simulation on HMT
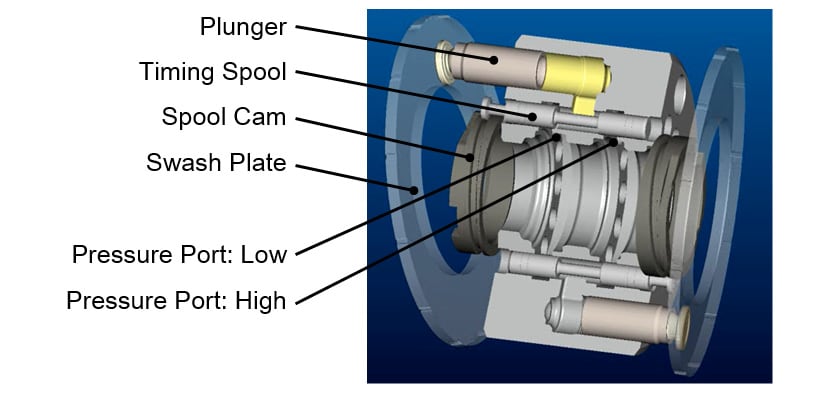
For the purpose of reducing the hydraulic noise, one-dimensional numerical model has been developed (Fig.3). This 1D model provides all forces and moments produced by the pressure in each plunger chambers, high and low-pressure ports. Hydraulic Oil flow from Plunger chamber is switched from low (high) pressure port to high (low) pressure port. It is well known that V-shaped notch on the valve plate is effective to reduce the high frequency noise of axial piston pumps [1]. This HMT has same functional part, which is named timing spool as shown in Fig.4. The spool geometry determines how quickly opens or closes the fluid path.
(b) Transmission vibration simulation
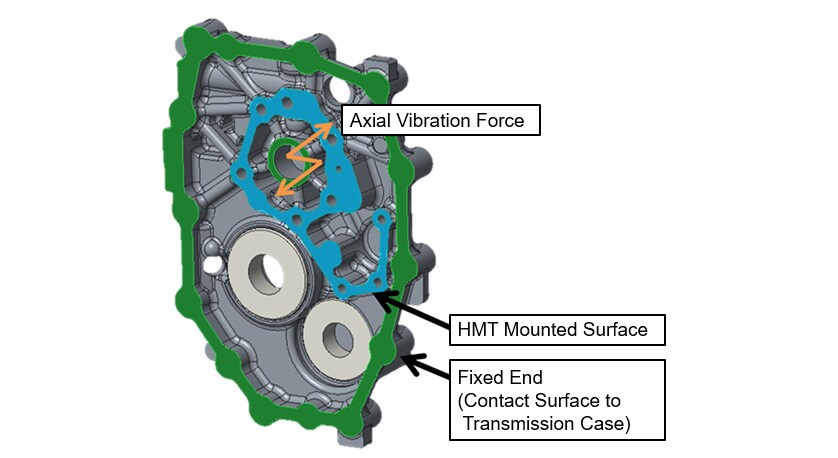
By using the calculated forces and moments, vibration speed of transmission cover has been calculated with FE frequency response analysis (Fig. 5). Forces calculated by 1D model was used to predict the transmission cover vibration. The axial forces have been applied to the cover surface where HMT is fastened and the whole edge of the cover has been treated as the fixed end.
(c) Sound pressure calculation
Sound pressure level has been calculated by using the vibration acceleration of the transmission cover's surface and equation (1), which was derived from the wave equation (2)[2].

where, SPL,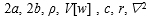 are sound pressure level [dB], height and width of sound source [m], air density [kg/m3],frequency spectrum of vibration velocity in discrete-time system, sound speed [m/s],distance from the sound source [m] and Laplacian; which means
  in Cartesian coordinate system of x, y, z-axis.
  is known as velocity potential function, which is expressed in formula (3) and (4); where sound pressure
  and medium particle velocity
  .
.

3. Results of Simulation
3.1. Hydraulic Pressure Simulation
1D model which calculates each plunger chamber and port pressure brought all forces and moments affecting to the cover where HMT is mounted. Table 1 shows the condition of the simulation. This condition represents the tractor operating mode in which tractor runs at quite slow speed; 0.35km/h with no traction load.
Table 1 Condition of Simulation

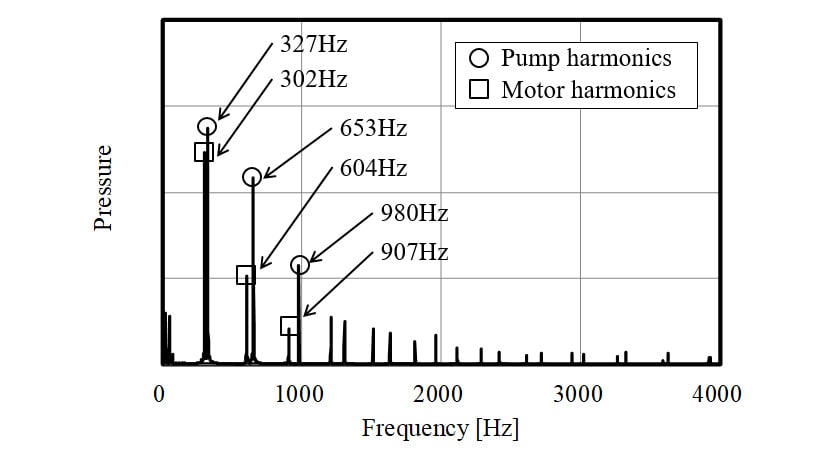
Fig.6 is a one example of the result which shows the pressure frequency spectrum in high pressure port. In this case, the plunger block rotates 2,800min-1; thus, the pump's 1st harmonic order is 327Hz because pump has 7 plungers, and the motor's 1st harmonic order is 302Hz because motor has also 7 plungers and motor rotates at the differential speed between input speed 2,800min-1 and output speed 210min-1. This result shows that the higher the harmonic order is, the lower the pressure spectrum peak becomes.
3.2. Transmission Cover Vibration
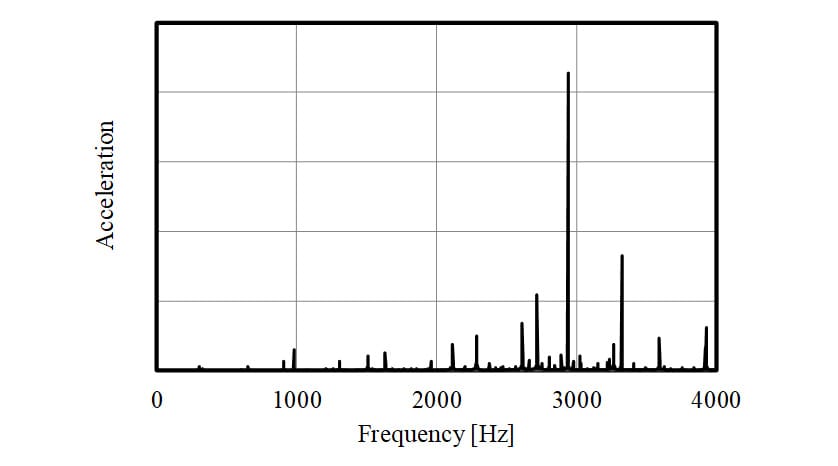
Fig.7 shows the vibration acceleration on the transmission cover surface calculated with FE frequency response analysis. The frequency spectrum has great peaks around 3kHz by the effect of a plurality of characteristic oscillation modes of the cover.
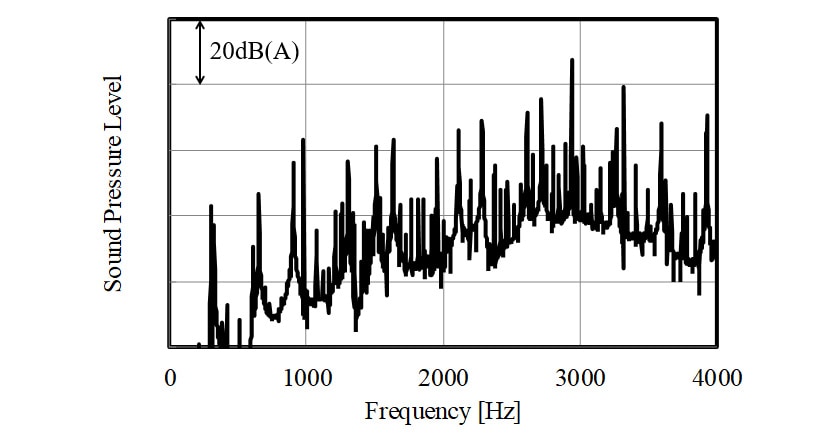
3.3. Sound Pressure Calculation
Fig.8 shows the result of sound pressure level prediction by using the vibration acceleration of the transmission cover and equations (1) and (2). This sound pressure level was simulated where the distance from the transmission cover is 1.0m.
4. Conclusion
This paper showed the method that predicts the transmission noise produced by the hydraulic pressure in HMT with using only design parameters. The result of the pressure simulated by 1D model was shown and the vibration acceleration on the transmission surface and the sound pressure level were predicted. In the next step, the experimental data will be measured and compared with this simulated result to be verified the prediction method.
5. References
- T. Grahl: 8 AFK, 1988, pp187-204.
- M. Ota: Basic information sound engineering, 1990, p. 86.
著者