YANMAR Smart Agriculture, Data utilization - REMOTE SENSING
Farm smarter with high-tech solutions
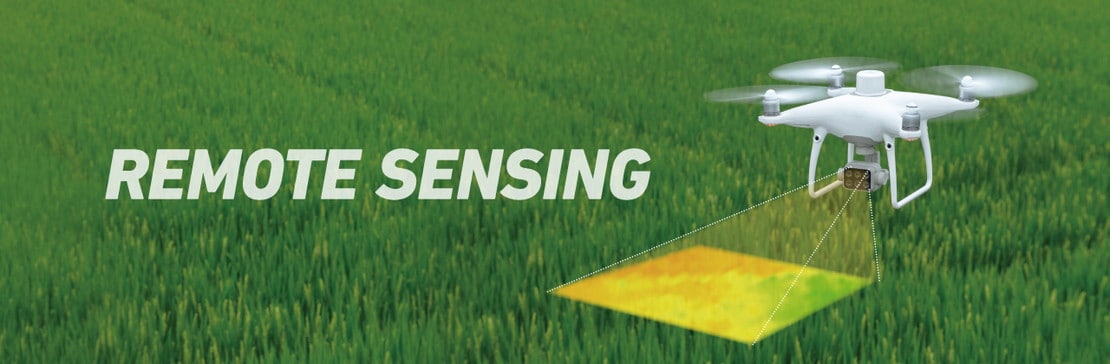
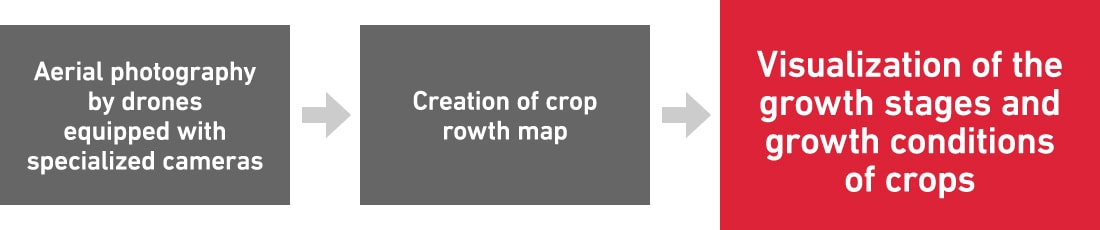
Remote Sensing is the advanced photographic technology that visualizes growth stages of crops by taking pictures.
About FarmEye
FarmEye Co., Ltd., a subsidiary of Yanmar, is expanding which performs agricultural field sensing and image analysis services, while also providing crop growth condition analysis and problem resolutions proposals.
They combine Yanmar’s agriculture equipment and agricultural business support capabilities with Konica Minolta’s sensing and image processing technology to support an environment where anyone can obtain the knowledge and know-how needed to carry on farming successfully.
Offering solutions for farmer’s problems through Remote Sensing
By accurately regulating farming material usage, average yields and quality can be improved while farming material costs can be kept at appropriate levels!

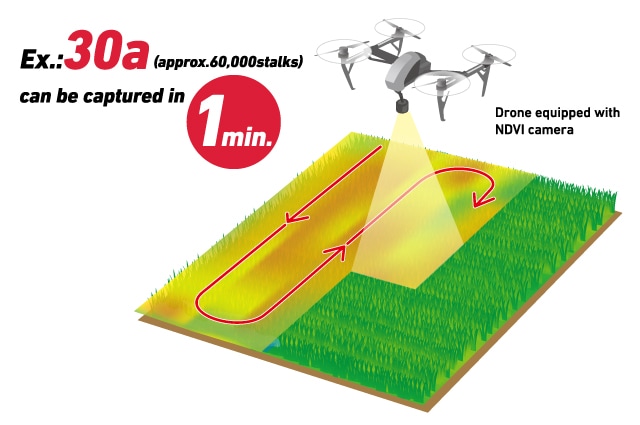
Solution 1. Using drones equipped with specialized cameras to perform speedy and accurate data measurements at any time of day and in any weather
Core technologies
- Sunlight adjustment technology →Adjusts to influences from time or weather
- Crop growth analysis algorithms →Data measurement at resolution of 3 cm2
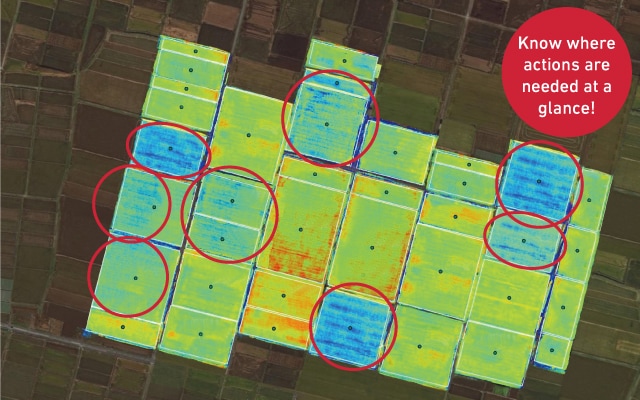
Solution 2. Visualizing variations in crop growth conditions using our unique image analysis technology to map crop growth status
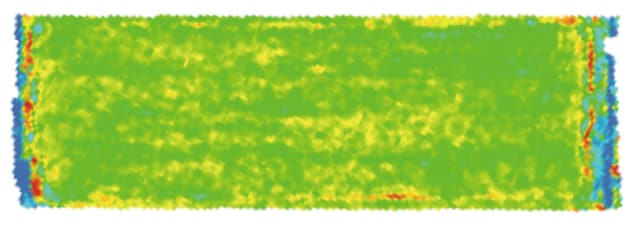
NDVI Map (SPAD Value)
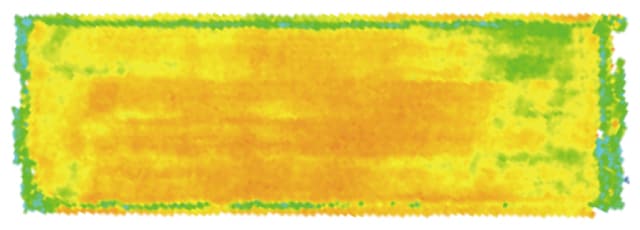
NDVI is highly correlated with SPAD value, and NDVI maps show distributions of plant growth activity levels.
- ※SPAD value is proportional to the amount of chlorophyll present in the leaf.
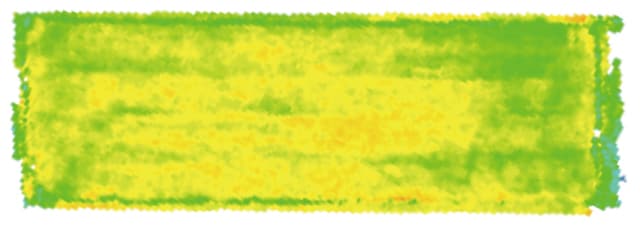
Vegetation Rate Map (Stem Numbers)
Vegetation rate is highly correlated with stem numbers, and vegetation rate maps show distributions of plant density.
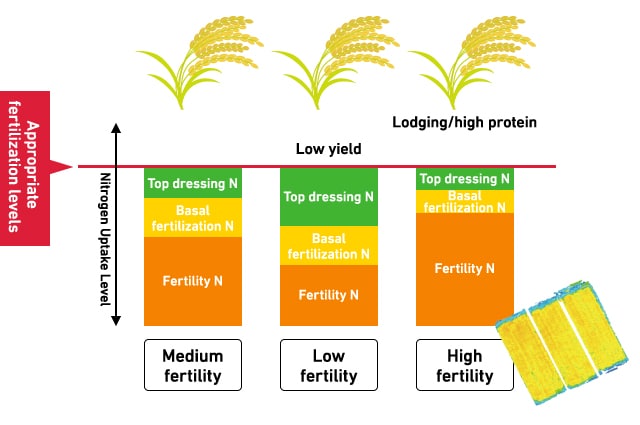
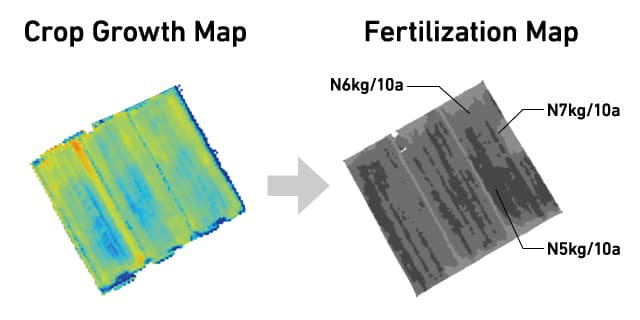
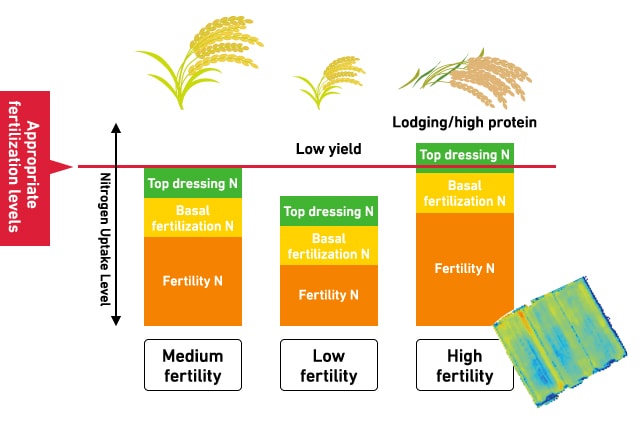
Crop Growth Map (Nitrogen Uptake Levels)
The combination of NDVI and vegetation rates is highly correlated with nitrogen uptake levels, and crop growth maps show distributions of nitrogen uptake levels.
Solution 3. Facilitating variable rate fertilization planning and efficient soil analysis using crop growth maps to assess variations in soil fertility
Fertilization Maps and Plans can be created based on soil analysis results and Crop Growth Maps created using “Remote Sensing”.
These can be used to control variable rate fertilization, which can help reduce variations in crop growth with the goal of attaining higher yields.
Such map data can also be stored.
Fertilization plans can be assessed by making comparisons with past data, enabling continuous improvements to be made.
Solution 4. Enabling optimized control of fertilizer usage levels by creating Fertilization Maps based on variations in soil fertility
Fertilizer usage levels can be controlled to match soil fertility using Fertilization Map data and variable rate fertilizing equipment.
Doing so eliminates variations in crop growth and improves both average yield and quality.
It also has the effect of bringing farming material costs to appropriate levels.
Fertilization until now…
Controlled fertilization