Research & Development Center
Research & Development Unit
YANMAR Technical Review
Prediction and Evaluation of Leveling Performance for Rotary Tillers
Abstract
In order to predict and evaluate the rotary tiller leveling performance, the pile height of soil tilled by the rotary tiller was experimentally measured by a laser range scanner and estimated using the rotary tillage model developed through the discrete element method (DEM). The comparison between the simulated and the experimental results indicated that this model was able to predict the pile shape of tilled soil. Additionally, this model was able to estimate the influence of mechanical specifications (rotary tiller width, rotary tiller blades arrangement and blade shape) on the root-mean-square (RMS) value of pile height distribution after tillage. The determination coefficient of the RMS value was 0.799.
1. Introduction
A wide variety of factors contribute to the performance of rotary tillers, including harrowing, soil turning, leveling, ability to plow in paddy straw, and power requirements. This article focuses on leveling. The leveling performance of rotary tillers influences accuracy of post-process including sowing or transplantation, and has very significant influence on the early stages of crop growth. The ability to use computer simulation to predict the effect that mechanical design parameters (rotary tiller width, rotary blade arrangement, and rotary blade shape etc.) have on the leveling performance of rotary tillers has the potential to be extremely valuable by significantly reducing the time and effort needed for design and performance evaluation.
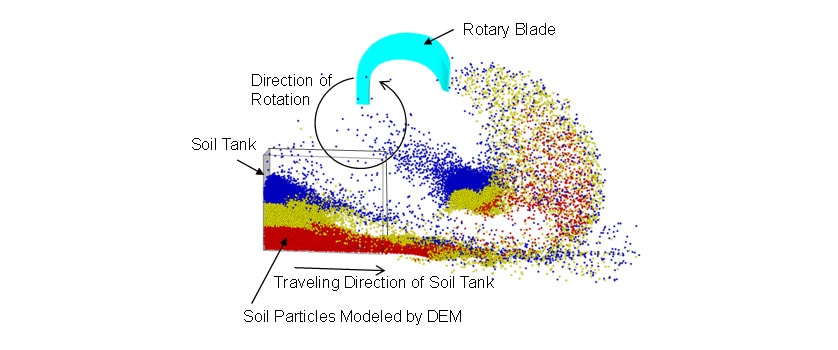
This article describes a method for evaluating leveling performance by using a rotary tillage model developed through previous research (2), (3)to predict the pile shape of tilled soil. The model is based on the discrete element method (DEM)(1) (see Fig. 1). To determine how the mechanical design parameters influence leveling performance, field testing was conducted using two different rotary tillers. The pile shape of tilled soil was measured using a laser range scanner and the calculation results of the rotary tillage model were compared with its actual measurements. The comparisons of rotary tillage model calculations and actual measurements were also verified about the influence of the mechanical design parameters and operating conditions (PTO gear selection and traveling speed) on the root mean square (RMS) value of the pile height of the tilled soil.
2. Method
2.1. Evaluation Test Method for Leveling Performance
The leveling performance of a rotary tiller was evaluated by performing tilling with the rear cover fully open and measuring the height variation and shape of the piled soil. Fig. 2 shows a rotary tiller performing a leveling performance evaluation test. Tests were conducted for two different rotary tillers. Tiller A had a width of 2.0 m and 44 blades. Tiller B had a width of 1.7 m and 36 blades. Both were down-cut tillers with side drive. Table 1 lists the blade principal dimensions, with both tillers using C-shaped blades (of the type called "natazume" in Japanese).
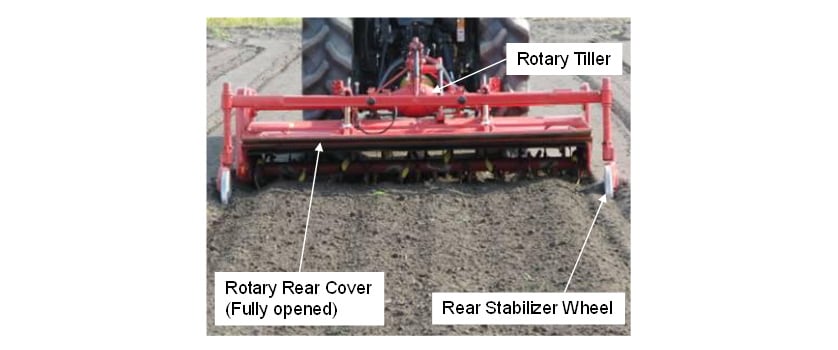
Table 1 Principal dimension of tested rotary blades
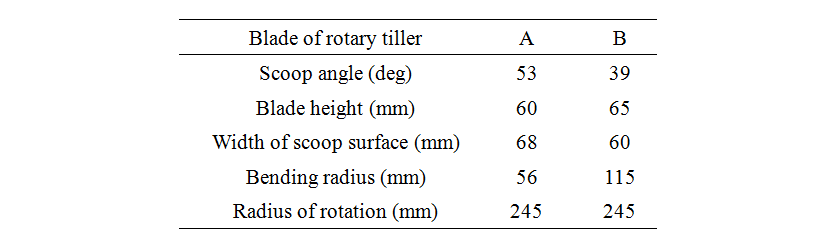
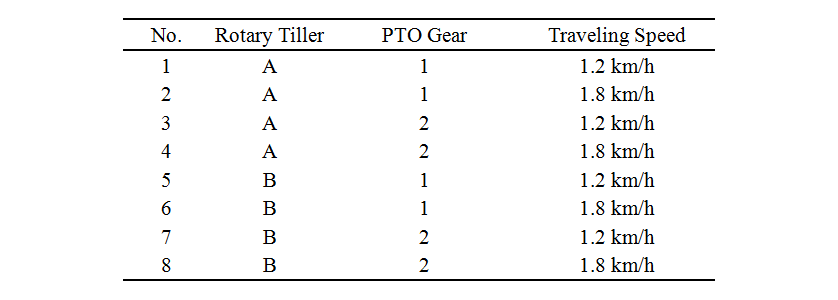
Table 2 lists the test conditions. A tail wheel was used during testing to maintain a constant tillage depth, which was set at 14 cm. Two models of rotary tillers, two tractor PTO gear shift positions, and two traveling speeds gave a total of eight sets of test conditions. The tractor PTO speeds were 544 rpm (for gear 1) and 761 rpm (for gear 2) respectively.
Table 2 Test conditions
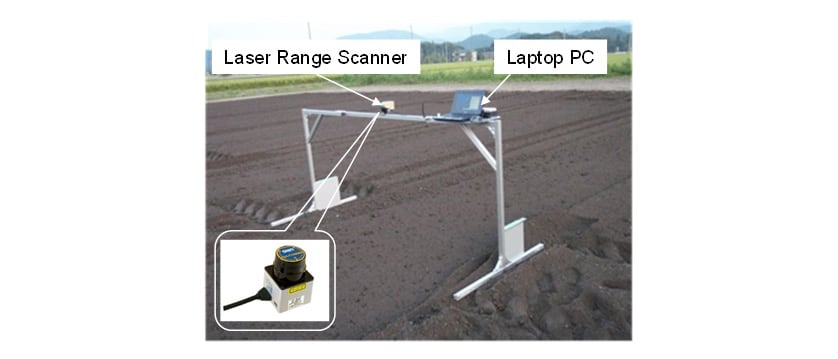
For rotary tillers, good leveling performance means a small height variation in the piled soil without large unevenness in the tillage width direction (4). This article uses the RMS value of the piled height of the tilled soil as an evaluation index of leveling performance. Pile shape was determined by using a laser range scanner (Hokuyo Automatic UGR-04LX) to measure the height of the projected and recessed shape from above. The scanner (see Fig. 3) was attached to the center of an aluminum frame with a height of 1.0m and an adjustable width of 1.5 m to 2.2 m and included a laptop PC for data logging and a power supply for the sensor. A level sensor was attached to the top of the aluminum frame and used to arrange the laser range scanner horizontally. Five cross-sections of the pile shape were taken at 30 cm intervals in the direction of travel after tilling for each of the test conditions. As the sensor system recorded data on soil height variations at intervals of approximately 0.36° (360°/1024) from the sensor centerline, linear interpolation was used to calculate the values at 1 cm intervals in the tillage width direction and these were then used to obtain the mean values of the five cross-sections.
2.2. Prediction Method for Pile Shape of Soil
The pile shape of tilled soil was predicted using a rotary tillage model (see Fig. 1) developed during previous research. The model parameters (soil particle diameter, density, friction coefficient, spring constant, damping ratio, and calculation time interval) and the modeling methods were the same as described in the reference(2). The model was calculated for the same eight sets of conditions as for leveling performance evaluation testing (see Table 2). The tillage depth was set at 14 cm. The tiller shaft speed used in the rotary tillage model was calculated from the speed of the tractor PTO shaft and the gear ratio (184 rpm for gear 1 and 258 rpm for gear 2).
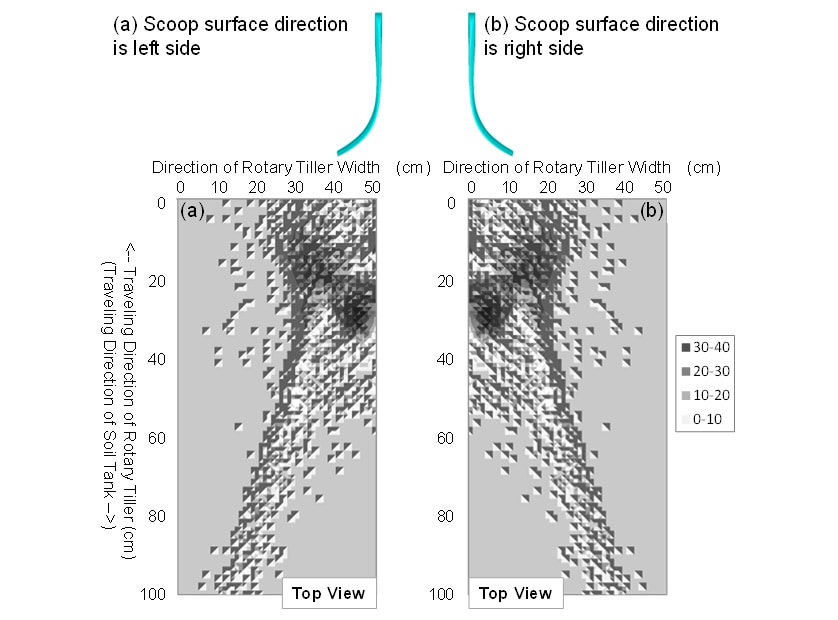
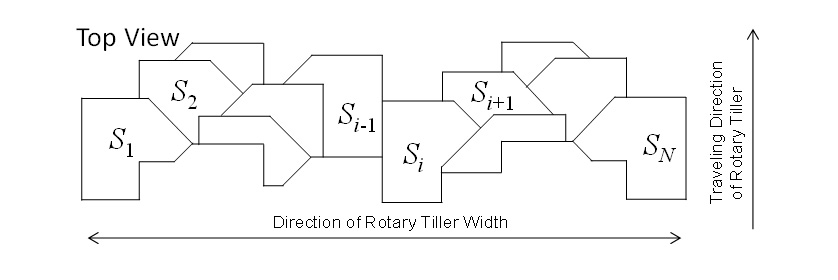
Fig. 4 shows an overview of how the pile shape of tilled soil is predicted. In this article, the mean soil pile height in the tillage width direction is defined as zero and the upward direction as positive. The distribution of soil particles used to predict the pile shape was obtained by summing the soil particle distributions for each blade obtained using the rotary tillage model. Fig. 5 shows an example soil particle distribution for one blade. Here, it was assumed that the number of soil particles tilled by a blade is dependent on the cutting surface area of the blade in the rotary tiller cutting pattern at the field surface (see Fig. 6). In Fig. 6, is the cutting surface area at the field surface for blade
  . The rotary tiller cutting patterns were calculated separately for each rotary tiller and test condition.

The distribution of soil particles due to rotary tilling  was given by equation (1).
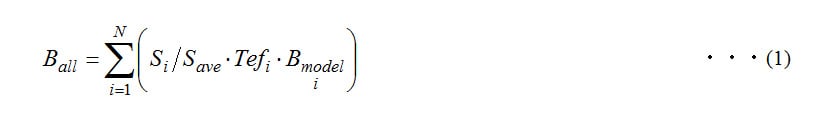
Here,  is the number of blades,
  is the mean cutting area of all blades,
  is a correction coefficient that takes account of the tread left by the rear tractor wheels, and
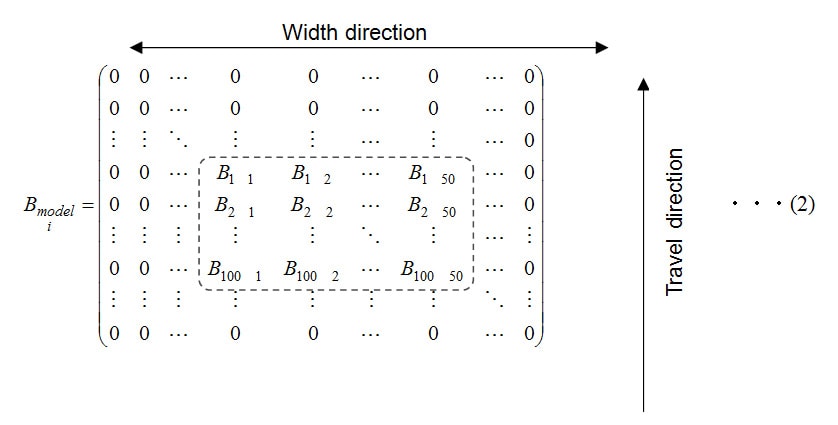
  is the distribution of soil particles calculated by the rotary tillage model for blade i. Both and are 120 rows x 255 columns matrices representing the soil particle distribution in each 1cm2 area. The rows correspond to the direction of travel and the columns to the width direction. As indicated by equation (2), is a 100 rows x 50 columns matrix of how soil particle distribution in Fig. 4 (corresponding to region enclosed in dotted lines in equation (2)) moved by each blade and each direction of blade curvature (right side or left side) based on the arrangement of blades in the travel and width directions.
The values of were defined by equation (3).
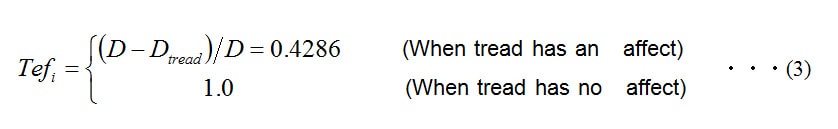
Here,  is the rotary tiller tillage depth and
  is the tread depth due to the rear tractor wheels. The model assumed that the amount of soil to be moved by the blades located behind the rear tractor wheels is reduced by depth of treads left by the wheels. As the rotary tiller tillage depth and tread depth obtained from leveling performance evaluation testing were 14 cm and 8 cm respectively, the correction coefficient was set at 0.4286 for blades affected by the treads and 1.0 for those not affected. The soil pile height of the model was calculated from the number of soil particles per unit area and soil particle volume by averaging the distribution of soil particles in the tilling direction.
3. Results and Discussion
3.1. Pile Shape of Tilled Soil
To predict the pile shape of tilled soil, the rotary tillage model was used to calculate the distribution of soil particles for each test condition. Fig. 7 and 8 show the tilled soil particle distributions for rotary tillers A and B respectively. The test condition is the PTO in gear 1 and a traveling speed of 1.2 km/h. The results show that rotary tiller A produces higher peaks in the distribution of soil particles than those of rotary tiller B. The results also show that in both cases the distribution has six small peaks. Fig. 9 shows the pile shapes observed during leveling performance evaluation testing under the same conditions as for Fig. 7 and 8. The pile shapes obtained using the laser range scanner are shown as overlays on the Fig. 9 photographs. A comparison of the measured pile shape and model predictions shows that the shape and number of peaks in the distribution of soil particles calculated by the model are similar to those in the pile shapes obtained by the field test measurements.
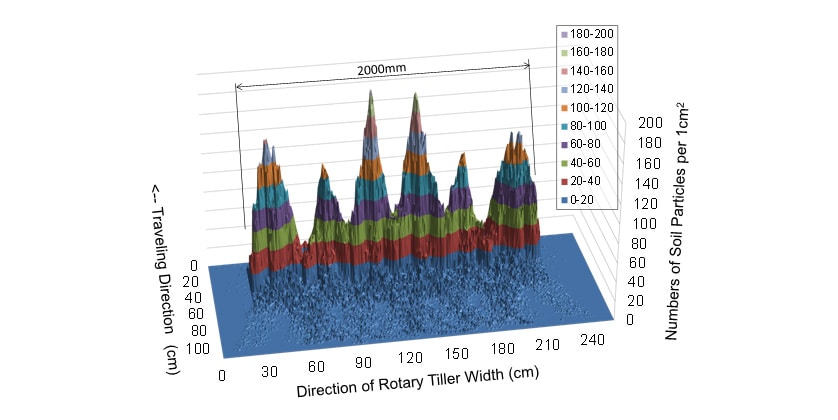
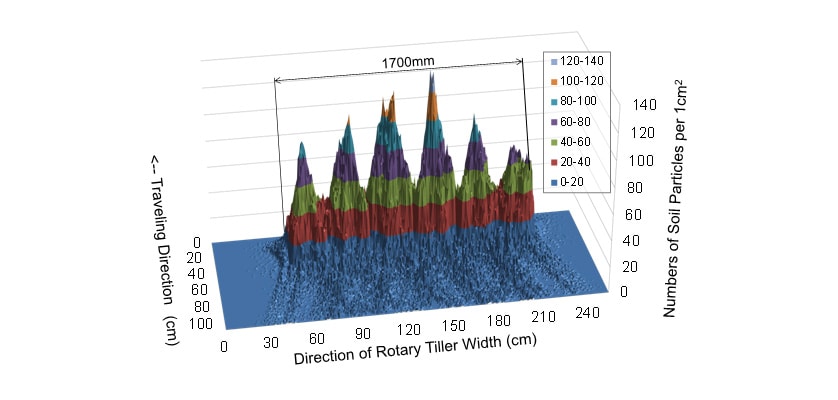
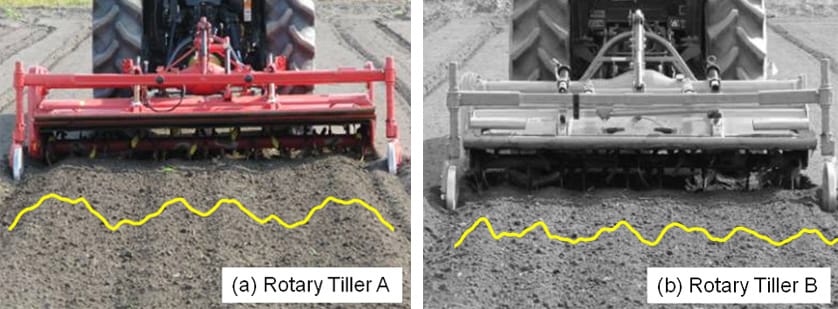
Fig. 10 shows a comparison of the model calculation and measured values for the piled height of the tilled soil for each rotary tiller that was used to perform a quantitative assessment of the suitability of the model predictions. The comparison is in the same test conditions as in Fig. 7, 8, and 9 (PTO in gear 1 and a traveling speed of 1.2 km/h). The comparison shows that the measured widths of end peaks for rotary tiller A are wider than the calculated values, and that while the four peaks seem to be visible, both rotary tiller A and B produced six small peaks that are roughly similar in shape and height. In the case of rotary tiller A, the maximum difference in pile height (difference between peak and trough) was calculated value of 67.2 mm compared to a measured value of 53.8 mm (calculated value was 124.9% of measured value). In the case of rotary tiller B, the maximum difference in pile height was calculated value of 46.5 mm compared to a measured value of 34.7 mm (calculated value was 134.3% of measured value). The results indicate that, for both the calculated and measured values, the maximum difference in pile height is higher for rotary tiller A than for rotary tiller B, suggesting that the rotary tillage model can potentially predict both pile shape and height.
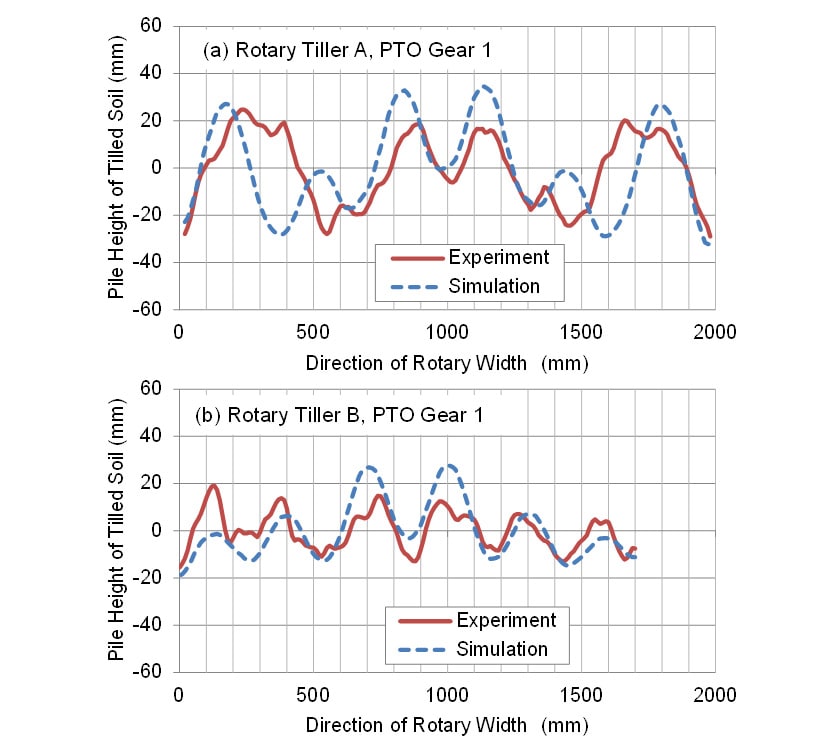
Fig. 11 shows a comparison of the measured and calculated soil pile heights for PTO gear 2 for the two rotary tillers. As can be seen in Fig. 11(a), the calculated soil pile height differs from the measured height for rotary tiller A. This is assumed to be due to tilting of the rotary tiller during leveling performance evaluation testing. In the case of rotary tiller B (Fig. 11(b)), there is good coincidence between the calculated and measured soil pile shapes. The maximum difference in the calculated soil pile heights was 31.3 mm and in the measured heights was 26.9 mm (calculated value was 116.7% of measured value). The results also show that rotary tiller A has a higher value of maximum difference in soil pile height than rotary tiller B for both measured and calculated values. This tendency is the same with the result for PTO gear 1. (Fig. 10).
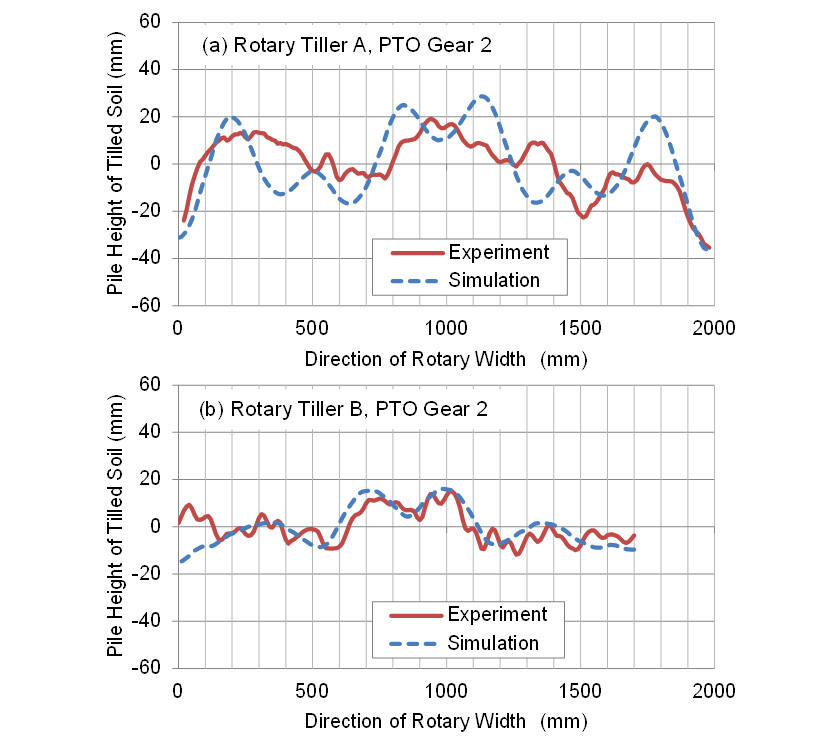
The rotary tillers A and B differ in all of their mechanical design parameters (rotary tiller width, blade arrangement, and blade shape), and the pile shape prediction method described in this article takes account of these mechanical design parameters. For PTO gears 1 and 2, both the measured and calculated values for maximum difference in soil pile height were higher for rotary tiller A than for rotary tiller B, indicating that this method has good potential for predicting how the mechanical design parameters (rotary tiller width, blade arrangement, and blade shape) influence pile shape.
3.2. RMS Values of Soil Pile Height
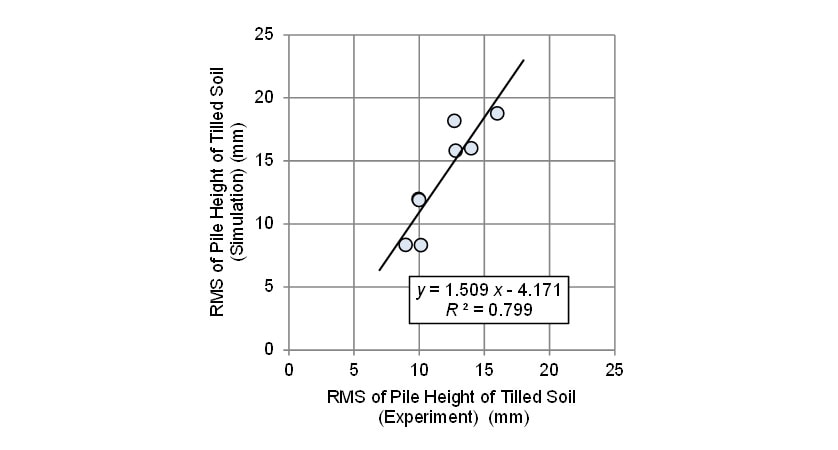
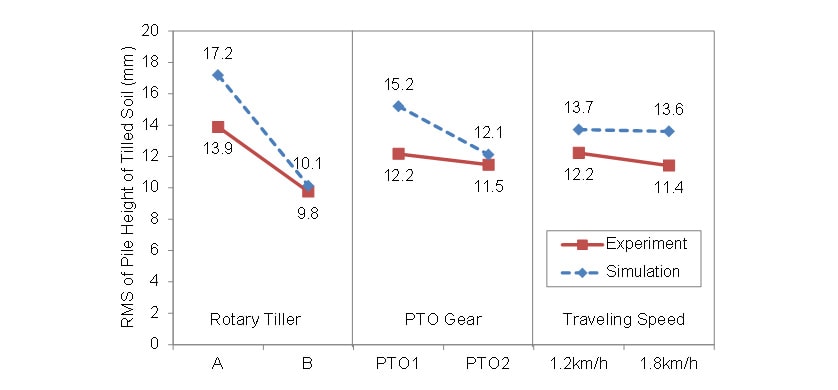
Fig. 12 shows the calculated and measured RMS values of tilled soil pile height in all test conditions. The line of best fit through the measured and calculated values had a gradient of 1.509 and a coefficient of determination ( R2) of 0.799. The RMS values of calculated soil pile height were on average 15.6% higher than the measured values. There are two possible reasons for this. The first reason is that, because the rotary tillage model works by counting the cumulative number of tilled soil particles as they land on the surface of the ground, it does not take account of the subsequent collapsing and stabilizing of soil particles that occurs in practice. The second reason is that the model does not allow for soil particles that have been thrown up by tilling subsequently coming into contact with another blade while still in midair, whereas, inside an actual rotary tiller, the soil will bounce by other blades. One way to improve further the pile shape prediction accuracy for rotary tilling would be for the model to include the subsequent collapsing and stabilizing of soil particles, with consideration for soil particles bounce by the blades. Another possible approach would be to use a large model that includes the entire rotary tiller. However, as increasing the size of the model to improve accuracy will come at the cost of a longer calculation time, a balance needs to be considered between required prediction accuracy and effort when choosing the modeling method.
A variance analysis of the RMS values of tilled soil pile height was conducted to assess quantitatively the influence of mechanical design parameters and operating conditions (rotary tiller, PTO gear shift position, traveling speed) on leveling performance. Fig. 13 shows the results for the main factors that influence pile height using the calculated and measured values respectively. For the calculated values, choice of rotary tiller had the greatest influence, followed by PTO gear shift position and followed by traveling speed. Choice of rotary tiller also had the greatest influence on the measured values, with the influence of PTO gear shift position and traveling speed being roughly equal. These results indicate that the mechanical design parameters (choice of rotary tiller) has a greater influence on the RMS values of pile height than the operating conditions (PTO gear shift position and traveling speed), and that this model can be used during rotary tiller design to predict the effect of mechanical design parameters (rotary tiller width, blade arrangement, and blade shape) on leveling performance.
4. Conclusion
To predict and assess the leveling performance of rotary tillers, a rotary tillage model was used to predict the pile shape of tilled soil. Field tests were conducted using two rotary tillers with different specifications to determine how mechanical design parameters influence leveling performance. A laser range scanner was used to measure the pile shape of tilled soil and the measurement results and the calculation results of the rotary tillage model were compared. The following knowledges were obtained.
- 1) The rotary tillage model can be used to predict the pile shape of tilled soil (the number and height of peaks).
- 2) The rotary tillage model can be used during rotary tiller design to predict the pile height of tilled soil and the effect of mechanical design parameters (rotary tiller width, blade arrangement, and blade shape) on leveling performance.
- 3) The coefficient of determination (R2) for the calculated and measured RMS values of pile height was 0.799.
References
- (1)Cundall, P. A., Strack, O. D. L., "A discrete numerical model for granular assemblies", Geotechnique, 29(1), 47-65, 1979.
- (2)Kazuaki Hirasawa, Takashi Kataoka, Hidekazu Niu, Takayuki Kubo, "Analysis of Dynamic Phenomenon in Rotary Tilling (Part 1):—Modeling of Soil Throw and Required Torque during Rotary Tilling—", Journal of the Japanese Society of Agricultural Machinery, 75(5), 307-315, 2013 in Japanese.
- (3)Kazuaki Hirasawa, Takashi Kataoka, Hidekazu Niu, Takayuki Kubo, "Analysis of Dynamic Phenomenon in Rotary Tilling (Part 2):—Influence of Rotary Blade Shape on Soil Throw and Required Torque—", Journal of the Japanese Society of Agricultural Machinery and Food Engineers, 76(1), P55-61, 2014 in Japanese.
- (4)Jun Sakai, Yasuo Shibata, "Design Theory of Rotary Blades Arrangement for Tractors", Journal of the Japanese Society of Agricultural Machinery, 40(1), 29-40, 1978 in Japanese.
-IMPORTANT-
The original technical report is written in Japanese.
This document was translated by Research & Development Management Division.