Fundamental Technology Research Center
Research & Development Center
Innovation & Technology Division
YANMAR HOLDINGS CO.,LTD
YANMAR Technical Review
Research on Component-based TPA Methodology for Modular Design
Experimental Approach to Accuracy Verification Using an Off-Road Vehicle
Abstract
The Yanmar Group is promoting the diversification of its prime mover, including electrification and carbon-neutral fuels. In this regard, we are promoting the application of Component TPA (hereinafter referred to as C-TPA) to completed vehicles, with a view to modular design for off-road vehicles, including those for construction and agricultural use. In this study, we investigate the effects of nonlinearity of acceleration in a forced vibration system generated by a prime mover and the number of conditions when identifying blocked forces using the inverse matrix method, focusing on off-road vehicles.
1. Introduction
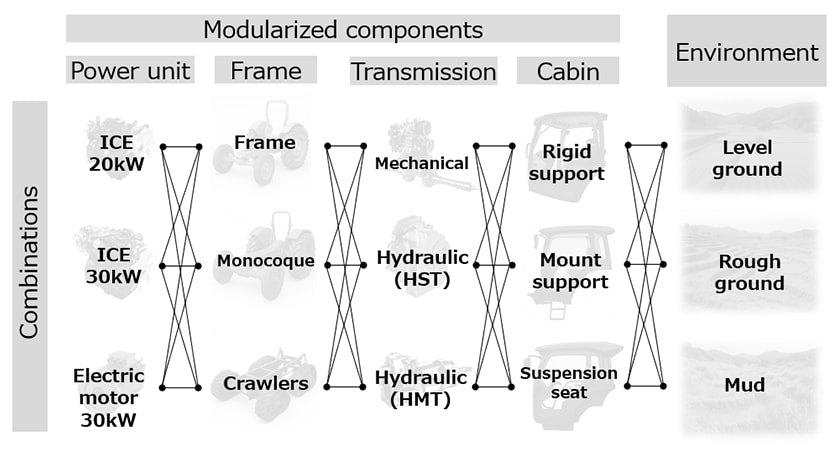
As presented in Figure 1, vehicles such as construction and agricultural machinery that are operated in off-road conditions are available in a wide range of variations, with different power units, frames, transmissions, and cabins. They also operate under a wide range of conditions, such as uneven ground, and their attachments are subjected to a variety of forces. Having so many different permutations means that these vehicles potentially require large amounts of design and evaluation work. For these reasons, Yanmar Group is promoting modular design for off-road vehicles with the aim of improving the efficiency of vehicle development.
One way of making the most of modular design is the use of component-based transfer path analysis (C-TPA)(1)(2), a method that has attracted increasing attention in the automotive industry over recent years. C-TPA is unique in that it can predict and evaluate the vibration and noise of the entire system without assembling the actual equipment by obtaining the vibration transmission characteristics of each component individually and virtually combining them. The enhanced flexibility that C-TPA provides at the design stage can improve development efficiency and reduce the number of prototypes required as it can be used to predict and assess the effects of changing the components of a system without building a prototype.
Despite this, C-TPA still faces technical challenges such as how to reduce error, and the automotive industry has yet to use it on complete vehicles(3)(4). Among the key factors relating to its practical deployment in development are ①Use of methods that assume linearity, and ②Determining an appropriate condition number to use in matrix inversion(4). This article describes an investigation and analysis of the impact that these two factors have on the estimation of vibration levels in off-road vehicles.
2. Vibration Level Estimation Using C-TPA
In C-TPA, the system response is calculated by linearly combining the inherent vibration characteristics of the components that act as vibration sources (active components) and the components that act as vibration transmission paths (passive components). In addition, the excitation force (C.F.) that can be directly measured during the actual operation of a completed vehicle depends on the vibration characteristics of the passive components, so there are limitations to its use in C-TPA. Therefore, we proceed with C-TPA using the blocked force (B.F.) method(5)(6), which calculates the specific excitation force that is independent of passive components.
Figure 2 shows the three-step process used to estimate the level of vibration VL at the response point from the vibration characteristics of the individual components. This involves: (i) B.F. identification, (ii) C.F. identification, and (iii) Estimation of vibration at the response point. Here, BFr and BFi are the B.F. identified for different passive components and VLCTPA and VL are the estimated and experimentally measured vibration levels respectively.
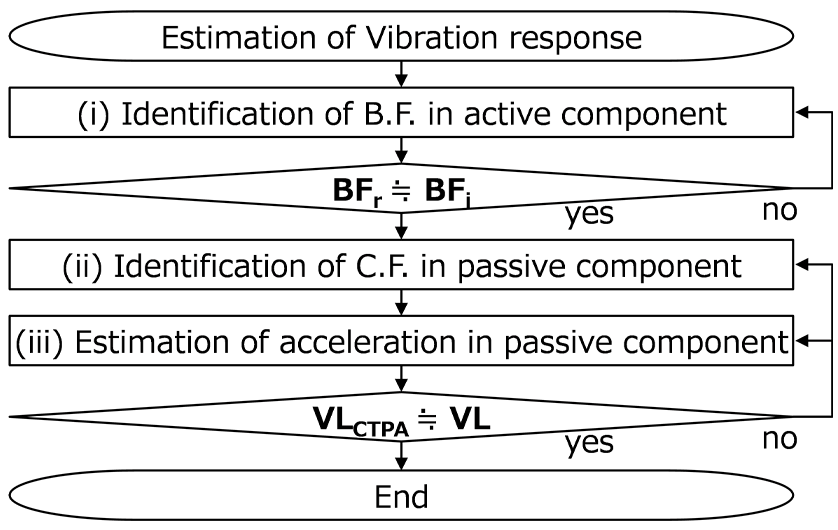
Figure 3 shows a schematic of a forced vibration system defined in terms of an active component that represents the power unit and a passive component that represents the vehicle body. Here, the numbers 1 to 5 in the figure respectively indicate the origin of the excitation force, the force point of the excitation force, the point of action of the excitation force, the vibration reference point, and the response point, as shown in Table 1.
In process (i) of Figure 2, B.F. is identified from the accelerance H42 between the force point (point 2) of B.F. caused by the excitation force (point 1) on the active component in Figure 3 and the reference point (point 4) on the passive component, and the acceleration a4 of the reference point (point 4) during actual operation, as shown in the following equation.

Here, BF2 indicates B.F. at the force point (point 2).
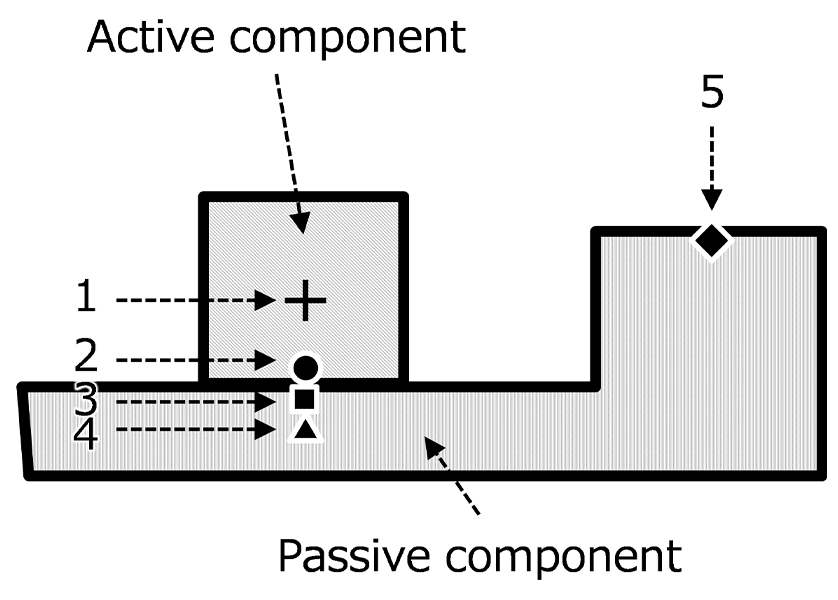
Table 1 Definition of each Point in Forced Vibration System
| Symbol Number | Symbol | Definition |
|---|---|---|
| 1 | + | Vibration source |
| 2 | ● | Effort point |
| 3 | ■ | Load point |
| 4 | ▲ | Reference point |
| 5 | ◆ | Response point |
In process (ii) of Figure 2, the C.F. acting on the passive component (point 3) from the B.F. of the force point (point 2) of the active component in Figure 3 is identified. The C.F. is obtained using the following equation by determining the transfer function from the active and passive component accelerance H22 and H33 and from the rigidity K of the mount between the active and passive components(7).

Here, CF3 is the C.F. on the passive component load point and ω is the angular velocity.
In process (iii) of Figure 2, the acceleration a5 at the response point (point 5) is estimated from the C.F. at the action point (point 3) of the passive component in Figure 3 and the accelerance H53 between the action point and response point, as shown in the following equation.

In addition, the acceleration a5 of the estimated response point is subjected to a frequency load based on the sensation of whole-body vibration as specified in ISO 2631(8) to determine the vibration level VLCTPA.
3. Vehicle Studied
3.1. Off-Road Vehicle
The off-road vehicle under study is an agricultural tractor weighing 3.5 t and equipped with a direct injection diesel engine with a rated output of 66 kW and a displacement of 3.1 L (Figure 4 and Table 2). Generally, there are two types of agricultural tractors: those with vibration-isolated supports for the prime mover and those with rigid connections. This vehicle is vibration-isolated.

Table 2 Vehicle Information
| Vehicle | Type | Agricultural Tractor |
|---|---|---|
| Length | 4.1 [m] | |
| Width | 1.8 [m] | |
| Height | 2.8 [m] | |
| Weight | 3.5 [t] | |
| Prime mover | Type | 4-cycle 4-cylinder diesel |
| Displacement | 3.1 [L] | |
| Rated output | 66 [kW] | |
| Rated speed | 2530 [min-1] |
3.2. Operating Mode and Vibration Level Evaluation
Agricultural tractors are typically used under heavy loads at a constant speed, with the engine rotation speed being set at the rated speed and the vehicle speed being adjusted by the transmission. In this study, the focus is on the forced vibration system caused by the prime mover, so the operating mode is set to idling operation at the rated rotational speed of the diesel engine shown in Table 2 (hereafter referred to as high idle operation). Furthermore, as described in Chapter 2, the vibration level VL is subjected to the frequency weightings specified in ISO 2631, so in the forced vibration system shown in Table 2, the vibration of the first frequency component ffreq = 84 Hz caused by diesel engine combustion is dominant, and higher-order frequency components are negligible.
3.3. Forced Vibration System
The forced vibration system for the target vehicle is defined as shown in Figure 5, being made up of an active component that represents the diesel engine and a passive component that represents the vehicle frame. The C.F. is input at the load point on the passive component (point 3) and the vibration is transmitted through the frame to the base of the driver’s seat. The variables in equations (1) to (3) shown in Chapter 2 are calculated at the points shown in Table 3 at the positions on the vibration transmission path shown in Figure 5. The diesel engine’s shaft power is transmitted to the transmission via the drive shaft, but as explained in Section 3.2, the operating mode is high idle with power cut off by the clutch, so the vibration transmission path via the drive shaft can be ignored.
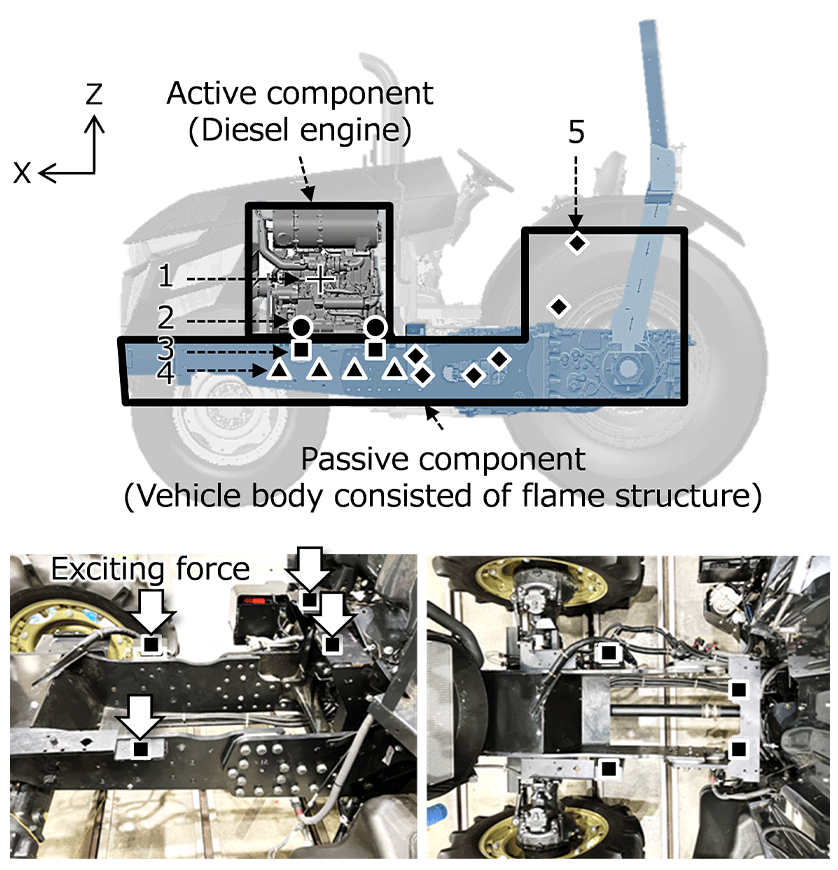
Table 3 C-TPA Measurement Points on Off-Road Vehicle
| Symbol Number | Symbol | Definition | Number of measurement points |
|---|---|---|---|
| 2 | ● | Effort points | 4 |
| 3 | ■ | Load points | 4 |
| 4 | ▲ | Reference points | 8 |
| 5 | ◆ | Response points | 6 |
4. Examination of application of C-TPA to off-road vehicles
4.1. Linearity of Forced Vibration System
When applying C-TPA, which assumes a linear system, to the forced vibration system of an off-road vehicle, we investigate the linearity of the impact excitation force F and the vibration response a. Figure 6 shows a representative component H22 of the accelerance H22 at the force point and a component H53 of the accelerance H53 between the action point and the response point in the impact vibration experiment. Accelerance H22 is constant with respect to the impact excitation force, and linearity is observed for the active component consisting of the diesel engine. On the other hand, the Accelerance H53 shows differences in levels depending on the strength of the impact excitation force F, and a nonlinear range can be seen in the passive components that make up the vehicle body. As off-road vehicles with frame construction are bolted together as shown on the bottom-left of Figure 5, these are contact-constrained except at locations where an axial force is present in the bolts. Therefore, it can be considered that at low inputs, the effects of misalignment and backlash are small and the output response is relatively high, while at high inputs, the effects of misalignment and backlash are large and the output response is relatively low. However, this non-linearity is limited to the operating ranges where exciting force F is comparatively weak (F < 4 N). Therefore, we are investigating the linearity/nonlinearity in the region that corresponds to the actual operation of the vehicle. Figure 7(a) shows the relationship between exciting force F used in vibration testing and the acceleration at response point a5. Figure 7(b) shows the acceleration at the response point a5 measured during actual tractor operation. As it is not possible to directly measure the exciting force in impact vibration testing that would correspond to the acceleration response in actual tractor operation, it was determined by the following process.
Step 1: Measure the acceleration for ffreq = 84 Hz in actual tractor operation. (Figure 7(b) a5=130 to 135 dB)
Step 2: Measure the acceleration for ffreq = 84 Hz for a variety of exciting force values. (Figure 7(a)).
Step 3: Determine the exciting force (in Figure 7(a)) that corresponds to a5=130 to 135 dB in Figure 7(b).
As shown in Figure 7, this process indicates that an exciting force F in vibration testing of about 7 N gives an acceleration response equivalent to actual tractor operation, indicating that the forced vibration system remains in the linear range during actual operation. Therefore, it can be determined that C-TPA can be applied to this forced vibration system, and it is believed that when using C-TPA on off-road vehicles consisting of a frame structure with nonlinear elements, a process for confirming the linearity of the system should be added before the scheme shown in Figure 2.
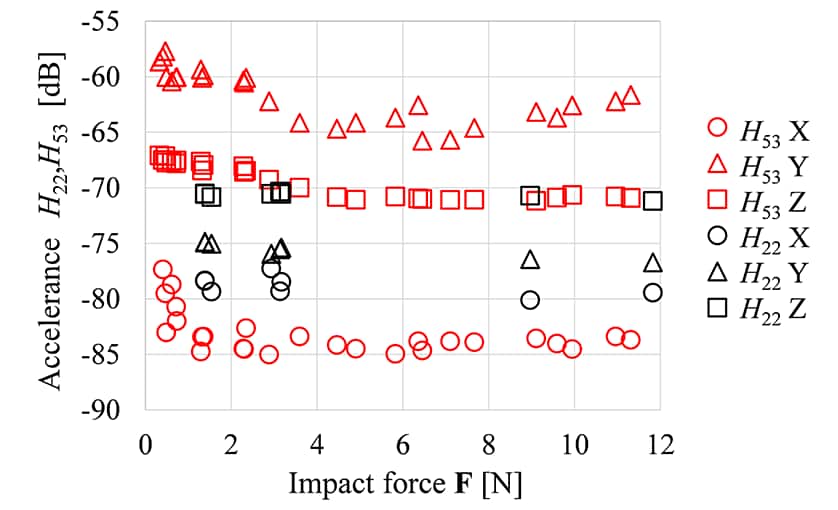
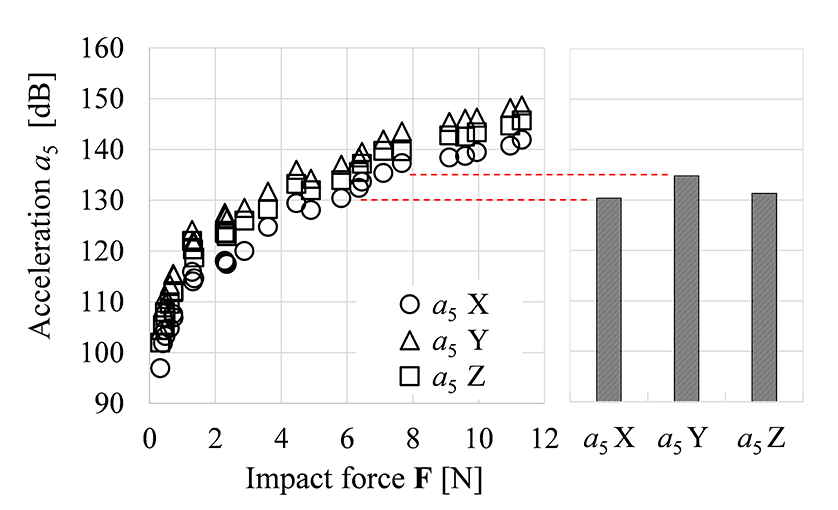
Figure 7 84-Hz Acceleration at Response Point (Point 5)
4.2. Error Sensitivity in Matrix Inversion Method
Error sensitivity was considered for the B.F. obtained by matrix inversion using equation (1). In this study, we assume a modular design in which the error factors in the input and output signals are unknown and consider an approach to reducing the sensitivity to errors by adjusting the condition number k(9). Figure 8 shows values of response point acceleration a5 obtained when different condition numbers were used for H42 matrix inversion. When the condition number k is around 101, the rate of error expansion is relatively small, but depending on the condition number k, differences of several tens of dB can appear in the acceleration of the response point, leaving room for adjustment. When adjusting the condition number k, the smallest singular value, which is thought to have a relatively large effect on the error, is ignored in order. As shown in Figure 8, when the condition number k < 10, the acceleration a5 of the response point decreases sharply. The condition number k can be understood as the ratio of the largest singular value to the smallest singular value, that is, the ratio of the influence of the transfer path on the response to the influence of the measurement error. From the mathematical interpretation of the condition number k, it can be understood that excessive adjustment results in the neglect of transfer paths with high contributions. Accordingly, when adjusting the condition number k to reduce B.F. error sensitivity, it makes sense to choose a k for which the change in acceleration response δa5/δk is comparatively small.
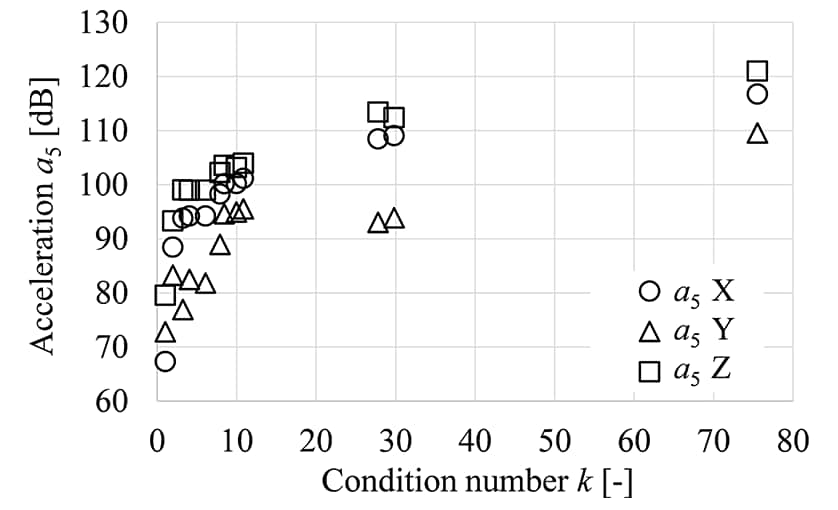
(a5 acceleration near seat for ffreq = 84 Hz)
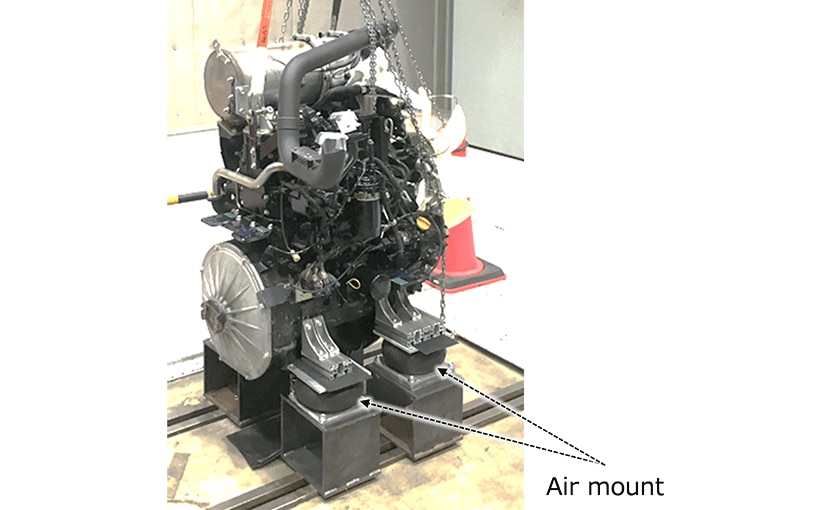
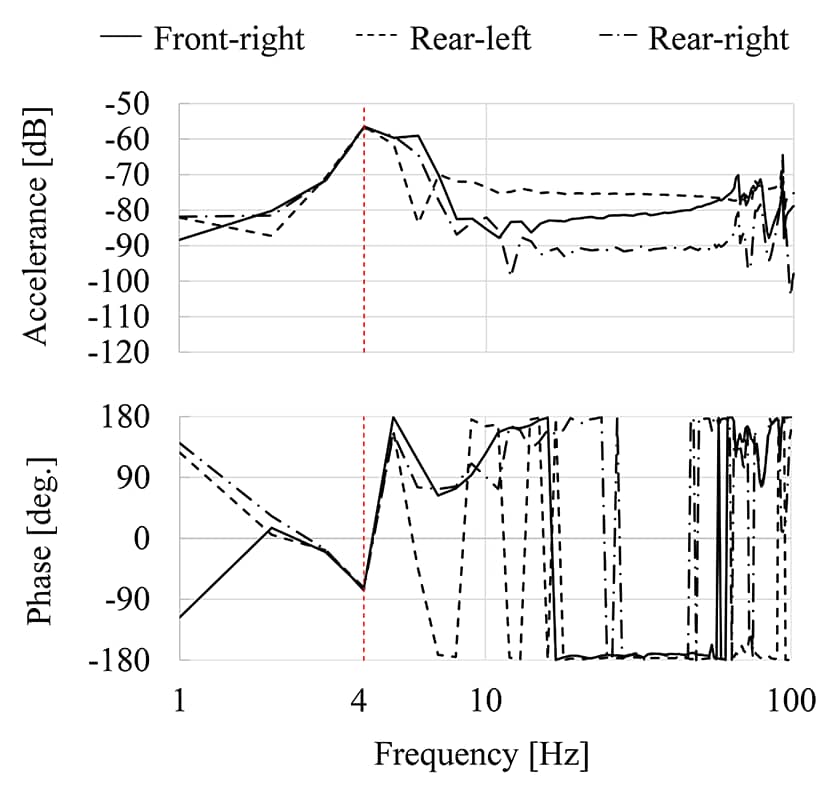
4.3. Measurement of Accelerance under Free-Edge Condition
The accelerance H22 specific to the active component in equation (2) is obtained through impact vibration experiments under free-end conditions, and in this study the free-end conditions are approximated by air mount support as shown in Figure 9. Figure 10 shows the accelerance H22 at three points (front right, rear left, rear right of the vehicle) excluding the impact excitation point (front left of the vehicle) at the force point (point 2) shown in Table 3. Since the amplitude peaks and phase rotations are identical, a rigid body mode can be recognized around 4 Hz. Furthermore, this rigid body mode can be determined to be a rigid body mode because it deviates from the primary combustion component ffreq = 84 Hz of the diesel engine in question, and it can be determined that the accelerance H22 specific to the active component has been appropriately obtained.
5. Estimation of Vibration Levels in Off-Road Vehicle
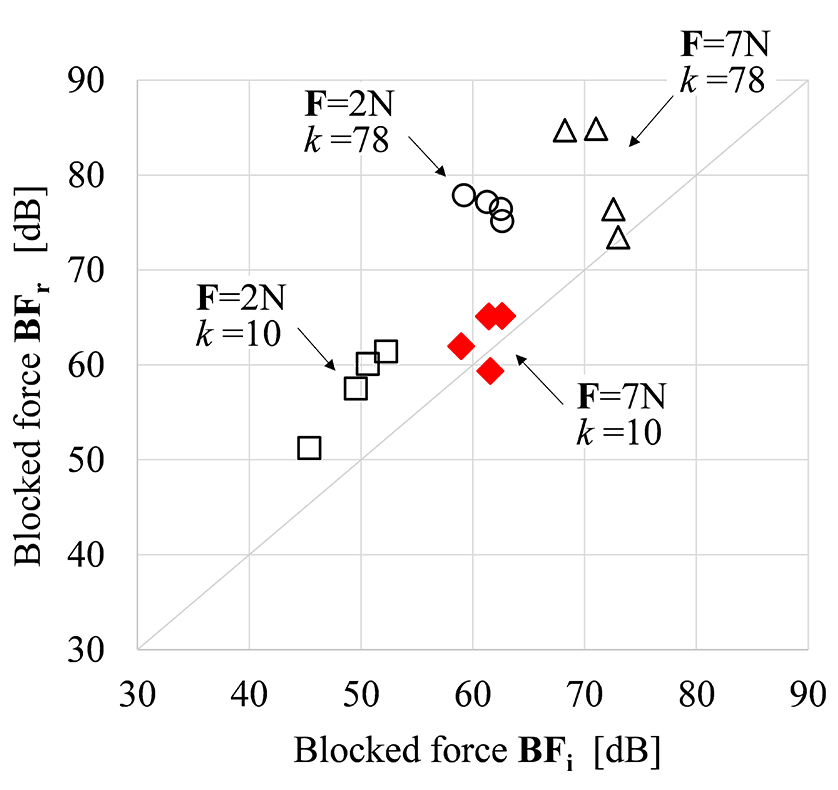
5.1. B.F. Identification
Since B.F. is an invariant vibratory force regardless of the passive component, the accuracy of B.F. identification is verified by the consistency of each B.F. identified with different passive components. Figure 11 shows the B.F. identified for the excitation force (F = 2 N, F = 7 N) and condition number (k = 10, k = 78) in multiple impact excitation experiments, with the horizontal axis representing BFr when the diesel engine is supported on a vehicle with vibration isolation and the vertical axis representing BFr when supported by a rigid connection. When the condition number k is relatively high (k = 78) with a relatively weak impact excitation force (F = 2 N), which falls in the nonlinear range of passive components, the discrepancy between BFi and BFr is relatively large at around 15 dB, demonstrating the importance of the linear range confirmation process proposed in Section 4.1 and the error sensitivity reduction proposed in Section 4.2. The B.F. (F = 7 N, k = 10) identified taking these factors into consideration showed a high degree of agreement between BFi and BFr, and the inherent characteristics of the active components were identified, independent of the passive components.
for Different Condition Numbers (ffreq = 84 Hz)
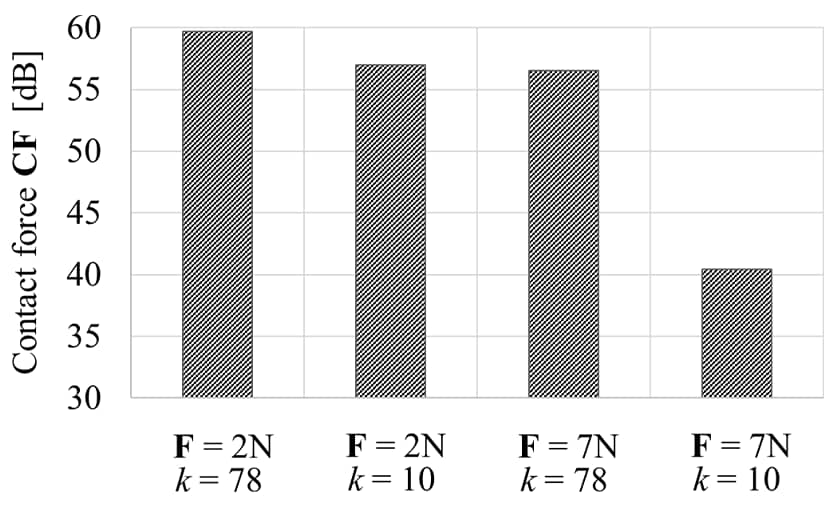
5.2. C.F. Identification
The C.F. is determined by putting B.F. into equation (2) and using a value of mount rigidity K based on the dynamic characteristics of the rubber mounts obtained in accordance with the JIS K6385 standard for rubber vibration isolator testing. As above, Figure 12 shows C.F. values obtained using the B.F. values from multiple impact vibration tests with different exciting forces (F = 2 N and F = 7 N) and condition numbers (k = 10 and k = 78). The C.F. values obtained from these impact vibration tests differ depending on the exciting force F and condition number k and this highlights the importance of choosing these appropriately.
for Different Condition Numbers (ffreq = 84 Hz)
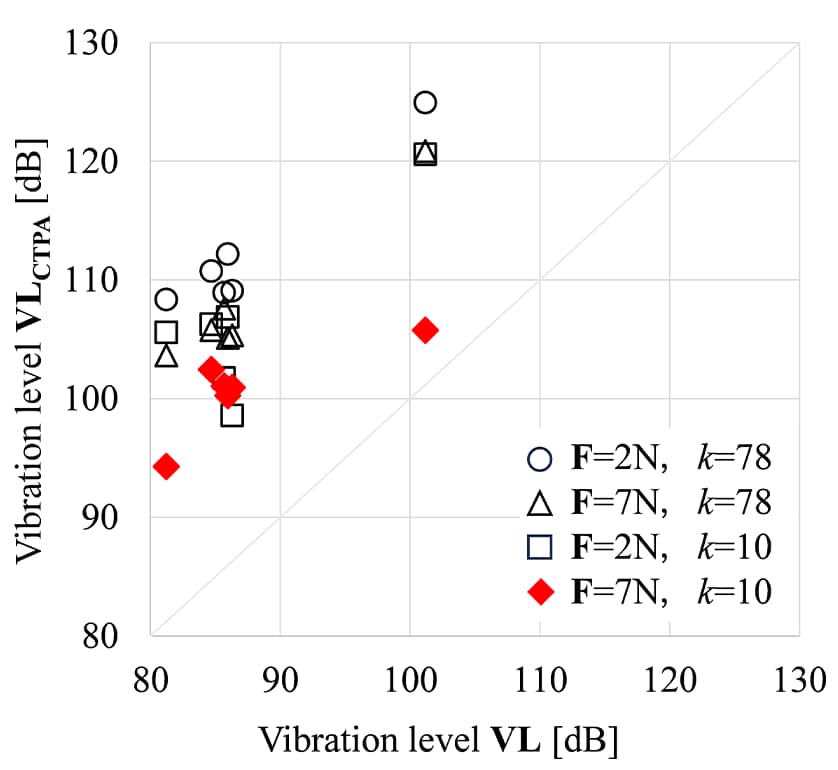
5.3. Vibration Response and Vibration Level Estimation
The acceleration a5 of the response point and the vibration level VLCTPA are calculated from the accelerance H53 between the action point and the response point of the C.F. and the passive component, as shown in formula (3). Figure 13 plots the vibration level obtained by C-TPA (VLCTPA) against the vibration level VL measured during actual operation to show a comparison of the results of impact vibration testing with different exciting forces (F = 2 N and F = 7 N) and condition numbers (k = 10 and k = 78). Based on the considerations in Chapter 4, the vibration level VLCTPA at a relatively high excitation force (F = 7 N) and adjusted condition number (k = 10) is closer to the vibration level VL during actual vehicle operation compared to the others, suggesting the importance of the linearity confirmation process and error sensitivity adjustment.
6. Conclusions
To promote modular design with the aim of improving the efficiency of vehicle development, C-TPA was applied to estimate the vibration level of the forced vibration system caused by the internal combustion engine for a completed off-road vehicle with a frame structure. Furthermore, we investigated and considered the effects of the nonlinearity of acceleration and the condition number k in the inverse matrix method. From this investigation and consideration, we obtained the following insights into the technical challenges involved in applying C-TPA to off-road vehicles.
① It was found that, in impact vibration testing, the response becomes non-linear when the exciting force F is low, but that linearity is maintained provided the exciting force is above a certain level. This indicates that it is essential when using C-TPA to include a linearity check and to use an appropriate exciting force.
② It was found that the error sensitivity in matrix inversion is such that the vibration response varies by several tens of dB depending on the size of the condition number k. A method for adjusting the condition number to minimize the error was proposed.
In the future, the challenges to further improving the reliability of C-TPA for assessing vibration levels will likely include optimizing the number of measurement points and their locations to adequately determine the vibration modes in the frequency bands of interest and reducing error in the matrix inversion calculation by using techniques such as the apparent-mass matrix method(3)(4). Based on these findings and future challenges, we will further accelerate the application of C-TPA to our modular designs and contribute to more efficient off-road vehicle development.
7. References
- (1)D. de Klerk, D.J. Rixen: Component transfer path analysis method with compensation for test bench dynamics, Mechanical Systems and Signal Processing, Vol. 24, No. 6, pp. 1693-1710 (2010)
- (2)M. V. van der Seijs, D. de Klerk, D. J. Rixen: General framework for transfer path analysis: History, theory and classification of techniques, Mechanical Systems and Signal Processing, Vol. 68-69, pp. 217-244 (2016)
- (3)Shigeyuki Kobayashi, Takuya Yoshimura: Variance Estimation for the Identified Force Spectra Based on Matrix Inversion Method, Transactions of the Japan Society of Mechanical Engineers (Part C), Vol. 77, No. 776, pp. 162-175 (2011) in Japanese.
- (4)Shigeyuki Kobayashi, Takuya Yoshimura: Identification of Excitation Force Spectra Using Apparent-mass Matrix, Transactions of the Japan Society of Mechanical Engineers (Part C), Vol. 75, No. 753, pp. 278-285 (2009) in Japanese.
- (5)A.S. Elliott, A.T. Moorhouse: Characterisation of structure borne sound sources from measurement in-situ, Acoustics ’08 Paris, pp. 1477-1482 (2008)
- (6)A.T. Moorhouse, A.S. Elliott, T.A. Evans: In situ measurement of the blocked force of structure-borne sound sources, Journal of Sound and Vibration, Vol. 325, No. 4-5, pp. 679-685 (2009)
- (7)Akio Nagamatsu, Masaaki Okuma, Component Mode Synthesis, Baifukan, p. 94 (1991) in Japanese.
- (8)ISO 2631-1:1997 Mechanical vibration and shock - Evaluation of human exposure to whole-body vibration - Part 1: General requirements (1997)
- (9)Masao Iri, Shinzo Kodama, Nobuhide Suda: Singular Value Decomposition and its Application to System Control, Measurement and Control, Vol. 21, No. 8, pp. 763-772 (1982) in Japanese.
-IMPORTANT-
The original technical report is written in Japanese.
This document was translated by Innovation & Technology Division, Technology Strategy Division.
Author